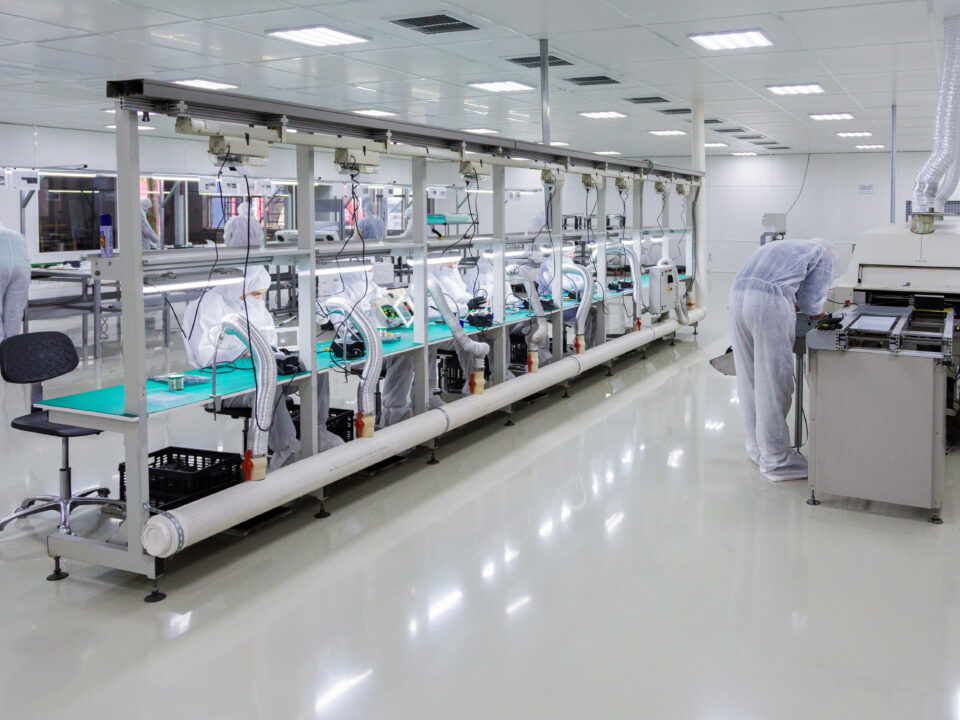
Industrial Process Optimization: Eliminate Bottlenecks

Maximizing efficiency in manufacturing is crucial for staying competitive in today’s fast-paced industrial environment. In this article, we dive into the analysis of a production line, focusing on industrial process optimization to boost capacity and minimize costs.
Understanding the Challenge of Process Optimization
In our case study, a manufacturing company produces components for the automotive industry. These components consist of three parts—A, B, and C—sourced externally at respective costs of $0.40, $0.35, and $0.15 per unit. The goal is to streamline the production process, reduce operational costs, and eliminate the bottleneck in the production bottleneck analysis.
Process Flow and Capacity Analysis
The assembly lines involves three stages in his Process flow:
- In Assembly Line 1, parts A and B are assembled at a rate of 140 components per hour.
- The next stage involves drilling part C, utilizing six mechanical drills, though only three are currently operational. Each drill processes 50 parts per hour.
- Finally, in Assembly Line 2, the drilled part C is combined with the output from Assembly Line 1, at a rate of 160 components per hour.

Initially, the plant operates 8 hours a day, 5 days a week, but increasing demand prompts the possibility of adding a second shift. By calculating the weekly production capacity for each stage, we identified that the first assembly line, with its capacity of 5600 components per week, is the initial bottleneck in the system.
Implementing an Optimized Production Strategy
To increase capacity, the company considers two scenarios:
- In Scenario A, both assembly lines operate for 16 hours per day, while four of the six drills are active. This increases the capacity of Assembly Line 1 to 11200 components per week, but the drilling process, limited to 8000 components per week, becomes the new bottleneck.
- In Scenario B, five drills operate for 8 hours per day, and the second shift on Assembly Line 2 is reduced to 4 hours. This setup yields a production capacity of 9600 components per week, with Assembly Line 2 now limiting throughput.
Cost Analysis and Decision Making
Cost is another critical factor in industrial process optimization. The cost of labor is $0.30 per unit for each assembly line and $0.15 per unit for the drilling process, with electricity costs at $0.01 per unit. Additionally, the company incurs a fixed weekly cost of $1200.
For Scenario A, producing 8000 components per week results in a total weekly cost of $14,480, while Scenario B, with 9600 components, costs $17,136. Analyzing these numbers helps management decide the most efficient and cost-effective strategy for scaling production.
Buying vs. Producing Part C: A Point of Equilibrium as a fundamental tool for Industrial Process Optimization
As part of the automation in manufacturing strategy, the company evaluates whether it should continue producing part C or buy it pre-drilled at $3 per unit. With the fixed cost of each drill at $30,000 and considering the company’s use of four drills, the break-even point is calculated at 4460.96 units annually. If the company produces more than 4461 units per year, it is more cost-efficient to produce part C in-house.
Conclusion: Streamlining for Success
The analysis of industrial process optimization in this case study highlights the importance of evaluating both production capacity and cost factors to eliminate bottlenecks. By identifying the bottleneck, management can make informed decisions about capital investments, labor shifts, and automation strategies. Implementing the right solution improves manufacturing efficiency and positions the company for future growth.
For more insights on manufacturing optimization, stay tuned to our blog for the latest strategies in industrial process improvement.