Assembly Lines: Definitions for Design and Improvements
Assembly Lines Definitions
What does assembly lines mean?
Certainly, assembly lines are a type of process technology involving a series of operations. These operations are carried out from raw materials, components, or semi-finished goods to generate a higher value output product.
The term assembly lines refer to a progressive assembly linked by some form of material handling medium. Generally, the steps follow a certain rhythm. The allowed processing time must be the same at all workstations within the line.
There are also significant differences between types of assembly lines. We can find a wide variety of assembly lines, such as:
- Some involve material handling devices (conveyor belts, roller conveyors, overhead crane)
- Others have line configurations (U-shaped, straight, branched)
- With rhythmic steps (mechanical, human)
- With product mix (single or multiple products)
- With different workstation characteristics. Workers may be seated, standing, walking with the line, or transported along with the line.
- Different line lengths (few or many workers)
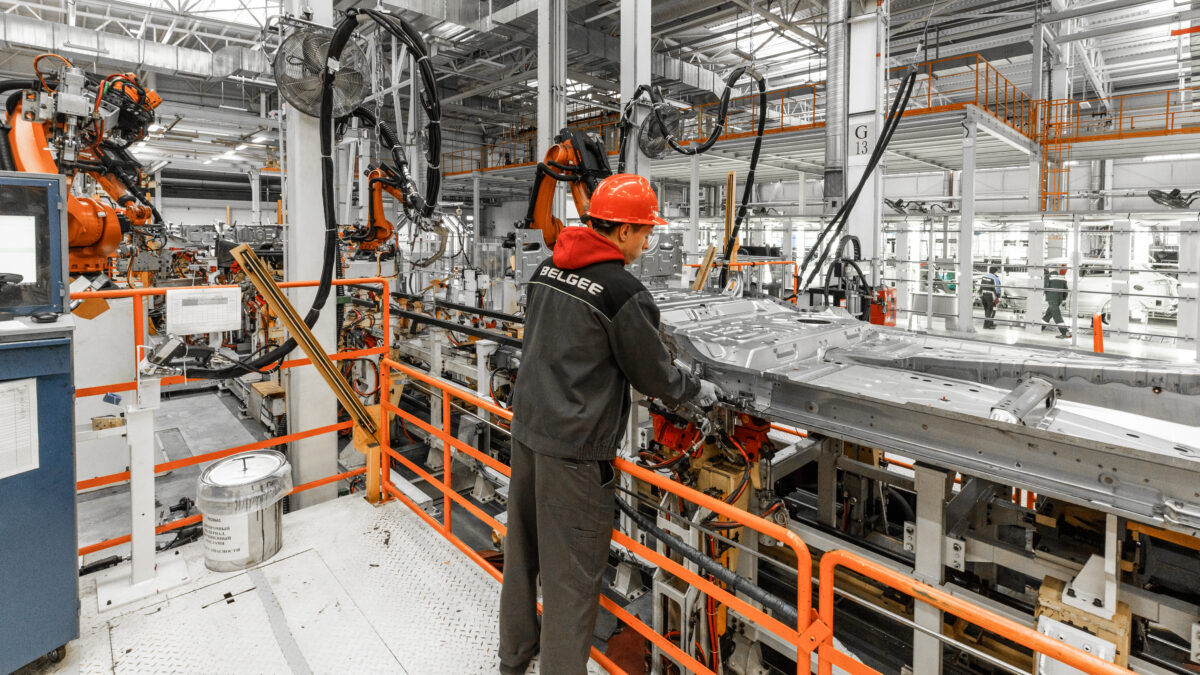
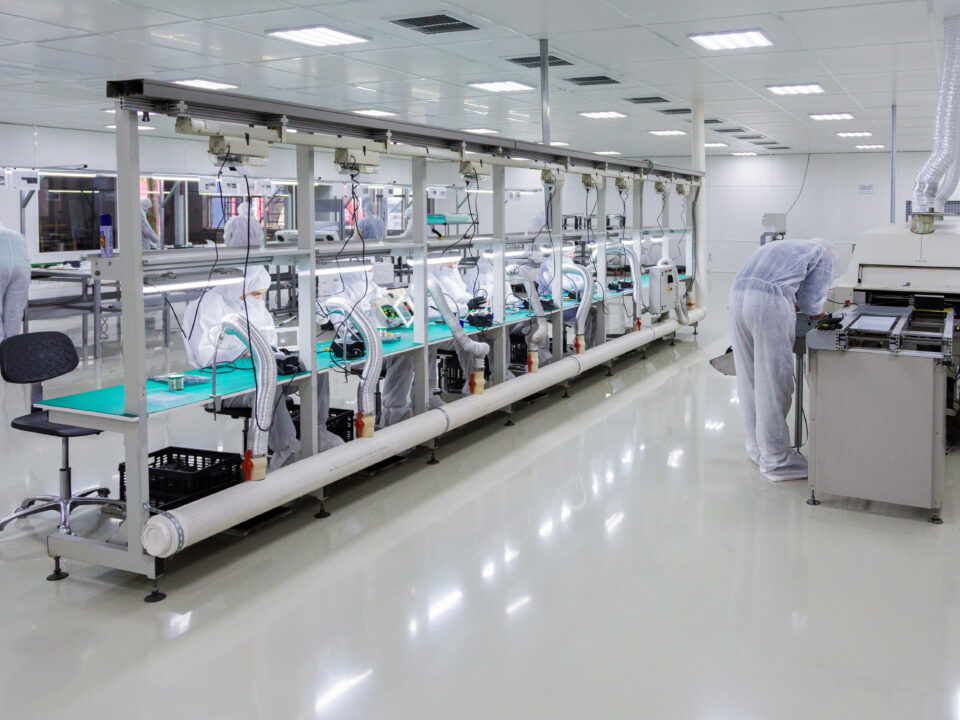
- The range of products assembled partially or fully on manufacturing lines includes toys, household appliances, automobiles, aircraft, firearms, gardening equipment, clothing, and a variety of electronic components. In fact, it would be valid to say that almost every product with multiple parts produced in large volumes uses assembly lines to some extent. This ensures establishing fixed parameters for quality management.
Of course, assembly lines are an important technology, and to truly understand their administrative requirements, one must be familiar with how to balance a line.
Characterization of Assembly Lines
What are the characteristics of assembly lines?
To characterize assembly lines, four time parameters must be defined:
Cycle Time
Cycle time (Tc) can be defined as the time elapsed between the production of two consecutive units of a product. It is expressed in seconds/unit or minutes/unit. It represents the cadence or speed of the process. Cycle time is of utmost importance as assembly lines are a cyclical process and determine the line’s capacity. The line’s capacity is the inverse of the cycle time of the longest activity (units/time).
This task is commonly known as the bottleneck activity. For example, if a bicycle assembly line has a cycle time of 50 seconds, it means that a finished bicycle exits the end of the line every 50 seconds. The capacity will be 72 bicycles per hour.
Process Time
Process time (Tp) is the time it takes to produce a single unit from start to finish of the line. It represents the sum of the partial times of each of the subprocesses, excluding waiting times due to intermediate stock. In the case of assembly lines, it would be the time for an operator to assemble a single product from its components. This is provided that the machines and facilities are set up for this purpose.
Flow Time
Flow time or Lead time (Tf) is the time taken by the product component with the longest journey to traverse the entire production process from start to finish. It represents the sum of the process time plus the time due to delays in intermediate stocks. This value gives an idea of the process agility or the ability to react to a change required by a customer.
Takt Time
This is a time definition that is often confused with cycle time. Takt time relates customer demand to available production time. It does so by measuring the rate at which we should produce to precisely meet customer demand (just-in-time production). In other words, it represents a production threshold.
If production occurs at a faster rate (cycle time shorter than takt time), we will have a capacity greater than demand. This will lead to significant idle times. If production occurs at a slower rate (with a cycle time longer than takt time), the demanded quantity will never be reached. This means that a portion of the market will remain unsatisfied.
The difference between cycle time and takt time is that the former is a design parameter and thus describes a production system. In contrast, takt time is a value obtained from market rhythm and production time.
To ensure that customer demand can be met, the design parameter should be: cycle time less than or equal to takt time.
How to Create Assembly Lines?
Assembly Line Balancing
Balancing assembly or manufacturing lines has implications for both production scheduling and plant layout distribution. In the latter case, the size or number of workstations would need to be physically designed to achieve a good balance.
Production on an assembly line is justified when a large number of identical units need to be produced in less time than the process time (Tp). This way, the work is divided into “tasks or activities” that are carried out by operators at workstations.
What is the objective of the assembly line?
The objective pursued is to try to synchronize the production rates of the different workstations. This is achieved by assigning the same amount of time (cycle time) to each station. When stations operate at different cycle times, imbalances occur. Consequently, idle times on the line will later decrease its capacity.
The magnitude of the cycle time of the bottleneck activity is very important for determining the amount of resources. That is, workstations, operators, and machines that we must use to supply the demand (takt time). The problem of line balancing consists of assigning all tasks to a series of workstations in such a way that none of them has more work than it can handle within the cycle time. Additionally, downtime in all stations should be minimized. To conduct a line balancing study, we will need the following information:
- Identify the tasks that make up the production process.
- Know the time for each task (which will emerge from a time study).
- The resources (infrastructure, machinery, and personnel).
- Establish the execution order imposed by product design and process technologies.
How to Create an Assembly Line? 7 Steps to Balance a Group of Work Activities
Steps for Balancing Assembly Lines. The steps to be taken to achieve line balancing are as follows:
Step 1: Assembly of the Precedence Diagram
Sequential relationships between tasks must be specified using a precedence flow diagram or flowchart (also called an operations diagram). In some cases, this analysis can also be complemented with a Gantt chart of the process. This diagram consists of circles and arrows. The circles represent individual tasks; the arrows indicate the execution order.


Step 2: Determine the required takt time to meet demand.
Takt time is the target time we should aim for in managing the assembly line. Based on this time, we will define various aspects associated with production planning. This includes delineating production hours for various items competing with each other, which are then scheduled through linear programming optimization models.
To calculate it, we must consider two things. On one hand, the available production time for that product, and on the other hand, the demand or required production. This may be expressed in hours, days, weeks, or months.
Takt Time = Available productive time / Demand
Step 3: Calculate the theoretical minimum number of workstations
In this step, we will calculate the number of workstations that, in theory, we need to comply with the demand set by the takt time. It should be noted that it should be rounded up to the next higher integer for correct processing.
theoretical minimum number of workstations = Sum of the time of all manual activities / Takt Time
Step 4: Define rules for assigning activities
A primary rule must be selected according to which tasks are assigned to workstations. It is also advisable to choose an additional secondary rule to break ties. Two examples of assignment rules could be to classify them from highest to lowest importance based on the number of dependent tasks they have associated.
Another alternative could be based on duration time. This will depend on the nature of the process and operations. There is a wide variety of assignment rules. Some are better than others depending on the type of problem to be solved.
Step 5: Perform task assignment
Tasks are assigned in the prioritization sequence from the previous step, one at a time. The goal is for the sum of the task times at each workstation to be equal to or less than the takt time. This is very important because if at least 1 station fails to meet this, the system will not be able to meet the expected demand. The process must be repeated at all stations until all tasks are assigned.
Once the complete assignment has been made, we can calculate the cycle time of the assembly line. Being a one-at-a-time process, we know that this will be the cycle time of the slowest station (the bottleneck).
Step 6: Evaluate the efficiency of assembly line balancing
The expression for calculating the efficiency of assembly line balancing is then defined. It is the ratio of the sum of manual task times (Ti) to the product of Nr (the actual number of stations) and Tc (cycle time).
Efficiency of assembly line balancing = Sum of the time of all manual activities /real numbers of stations * Cycle Time
Step 7: Improve
If the efficiency is unsatisfactory, rebalancing is performed using another decision rule.
If you’ve made it this far because you wanted to see examples, we’ve included a Course on Operational Process Management below, sign up to learn more!
Did you enjoy this content? Follow us on our social media for more articles, tools, and resources on industrial engineering:
